138 Results for Circular Charts by DICKSON
Key Features:
- Item: Circular Paper Chart
- Chart Size (In.): 8 in
- Range: 0 Degrees to 100 Degrees F/C
Key Features:
- Item: Circular Paper Chart
- Chart Size (In.): 8 in
- Range: 0 Degrees to 1000 Degrees F/C
Key Features:
- Item: Circular Paper Chart
- Chart Size (In.): 4 in
- Range: 0 to 200 psi
Key Features:
- Item: Circular Paper Chart
- Chart Size (In.): 4 in
- Range: 0 to 300
Key Features:
- Item: Circular Paper Chart
- Chart Size (In.): 4 in
- Range: 0 to 100
Key Features:
- Item: Circular Paper Chart
- Chart Size (In.): 6 in
- Range: 0 Degrees to +/-100 Degrees F/C, 0 to 100
Key Features:
- Item: Circular Paper Chart
- Chart Size (In.): 4 in
- Range: -30 Degrees to 50 Degrees C
Key Features:
- Item: Circular Paper Chart
- Chart Size (In.): 6 in
- Range: -50 Degrees to 50 Degrees F/C
Key Features:
- Item: Circular Paper Chart
- Chart Size (In.): 8 in
- Range: 40 Degrees to 110 Degrees F
Key Features:
- Item: Circular Paper Chart
- Chart Size (In.): 8 in
- Range: -20 Degrees to 120 Degrees F
Key Features:
- Item: Circular Paper Chart
- Chart Size (In.): 4 in
- Range: -22 Degrees to 122 Degrees F
Key Features:
- Item: Circular Paper Chart
- Chart Size (In.): 8 in
- Range: 0 Degrees to 500 Degrees F/C
Key Features:
- Item: Circular Paper Chart
- Chart Size (In.): 4 in
- Range: 0 to 200 psi
Key Features:
- Item: Circular Paper Chart
- Chart Size (In.): 8 in
- Range: -50 Degrees to 50 Degrees F/C
Key Features:
- Item: Circular Paper Chart
- Chart Size (In.): 8 in
- Range: 0 Degrees to 250 Degrees F/C
Key Features:
- Item: Circular Paper Chart
- Chart Size (In.): 8 in
- Range: -20 Degrees to 50 Degrees C
Key Features:
- Item: Circular Paper Chart
- Chart Size (In.): 4 in
- Range: 0 Degrees to 100 Degrees F
Key Features:
- Item: Circular Chart Recorder
- Chart Size (In.): 4 in
- Recording Time (Day): 1 or 7
Key Features:
- Item: Circular Paper Chart
- Chart Size (In.): 6 in
- Range: 0 Degrees to 500 Degrees F
Key Features:
- Item: Circular Paper Chart
- Chart Size (In.): 8 in
- Range: 0 Degrees to 200 Degrees F/C
Key Features:
- Item: Circular Paper Chart
- Chart Size (In.): 6 in
- Range: 0 Degrees to 250 Degrees F/C
Key Features:
- Item: Circular Paper Chart
- Chart Size (In.): 4 in
- Range: -18 Degrees to 37 Degrees C
Key Features:
- Item: Circular Paper Chart
- Chart Size (In.): 8 in
- Range: -20 Degrees to 120 Degrees F
Key Features:
- Item: Circular Paper Chart
- Chart Size (In.): 8 in
- Range: 0 Degrees to 200 Degrees F/C
Key Features:
- Item: Circular Paper Chart
- Chart Size (In.): 4 in
- Range: 0 to 300 Psi
Key Features:
- Item: Circular Paper Chart
- Chart Size (In.): 8 in
- Range: 0 Degrees to 14 Degrees F
Key Features:
- Item: Circular Paper Chart
- Chart Size (In.): 8 in
- Range: 0 Degrees to 1000 Degrees F/C
Key Features:
- Item: Circular Paper Chart
- Chart Size (In.): 6 in
- Range: 0 Degrees to 50 Degrees C
Key Features:
- Item: Circular Paper Chart
- Chart Size (In.): 4 in
- Range: -20 Degrees to 120 Degrees F
Key Features:
- Item: Circular Paper Chart
- Chart Size (In.): 8 in
- Range: 0 Degrees to 250 Degrees F/C
Key Features:
- Item: Circular Paper Chart
- Chart Size (In.): 6 in
- Range: 0 Degrees to +/-50 Degrees F/C
Key Features:
- Item: Circular Paper Chart
- Chart Size (In.): 3 in
- Range: 22 Degrees to 68 Degrees F
Key Features:
- Item: Circular Paper Chart
- Chart Size (In.): 8 in
- Range: 0 Degrees to 500 Degrees F/C
Key Features:
- Item: Circular Paper Chart
- Chart Size (In.): 8 in
- Range: 0 Degrees to 100 Degrees F/C
Key Features:
- Item: Circular Paper Chart
- Chart Size (In.): 8 in
- Range: 5 Degrees to 40 Degrees C
Key Features:
- Item: Circular Paper Chart
- Chart Size (In.): 8 in
- Range: 40 Degrees to 110 Degrees F
About Circular Charts
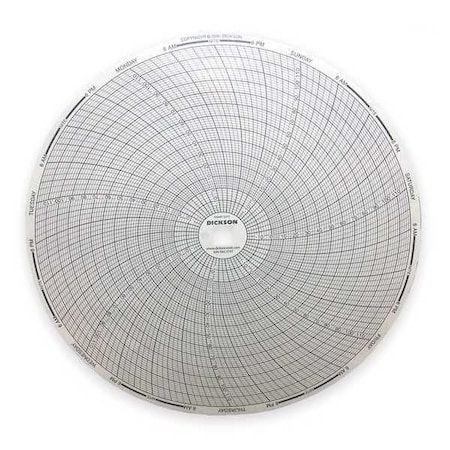
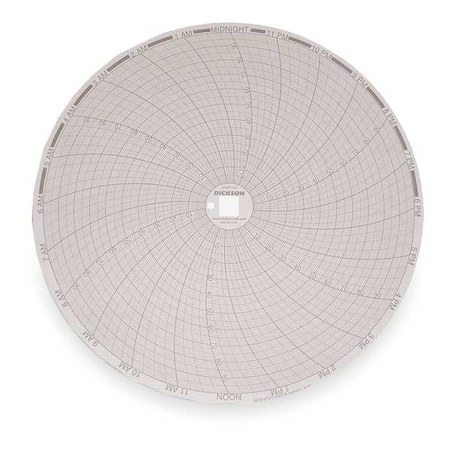
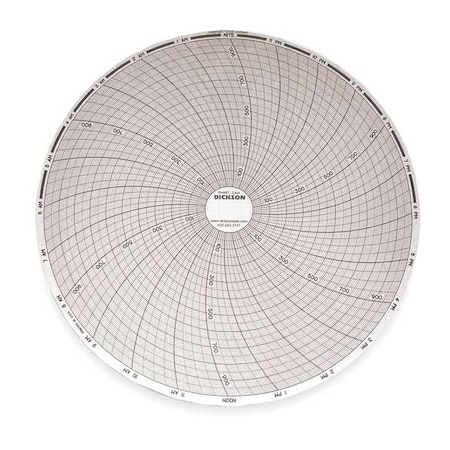
Circular Charts are a type of graph used to display data in a circular format. They are commonly used to represent relative proportions, or to compare parts of a whole, such as percentages or fractions. Circular Charts are often used in business presentations and scientific research.
Types of Circular Charts
Circular Charts can be divided into several different types depending on the purpose for which they are being used. Pie charts, donut charts, and ring charts are all examples of Circular Charts that have slightly different applications and uses. For example, pie charts may be better suited for displaying overall proportions while donut charts may be better suited for comparing parts of a whole.
How Circular Charts are Made
Circular Charts can be made using various software programs such as Excel or PowerPoint. These programs allow users to input data and create visual representations of that data in the form of Circular Charts. Additionally, many online tools exist that allow users to create professional-looking Circular Chart graphics with minimal effort.
Industries that use Circular Charts
Circular Charts are widely used across many industries including finance, marketing, education, healthcare and more. Professionals in these fields use them to visualize data quickly and effectively so they can make informed decisions about their businesses or research projects.
Find the Circular Charts You Need at Zoro
Looking for a specific item? Use our robust search tool to find it by name or keyword, or use our handy filters to narrow down our full assortment. You can also check out our whole selection of circular charts, along with other tools or equipment to ensure you have all you need to tackle the job, especially if you're taking on a DIY project for the first time.
Plus, when you shop at Zoro, you'll always enjoy competitive prices on tons of great brands you know and trust. We make the shopping experience as fast and seamless as possible with free shipping on orders over $50 for registered users, Net 30 payment terms for qualifying customers, and an unparalleled customer service experience.